Counting primary stakeholders
People indicators are used for outreach, process, output, and outcome measurements, and may be represented as either an integer or a percentage.
Number of persons is used when the indicator value is an exact count of primary, and sometimes secondary, stakeholders. This is common for output indicators where participants or recipients can be counted through attendance lists, registration sheets, or other documentation of project activities. In addition, each project is required to report on total number of people reached by the project activities/involved in the project (primary stakeholders) and total number of people reached indirectly by the project activities (secondary stakeholders).
Number of people is used when the indicator value is an estimate, typically for outcome indicators. This applies when the intervention is expected to influence behaviour, knowledge, or attitudes within the target population. The estimate is based on surveys with representative samples. For interventions affecting the entire target population, e.g., access to a new water point, outreach can be estimated using population data to determine how many people live in the catchment area. Reporting should include clear explanations of the methodology, such as sample size and the ratio used to estimate the total population impacted.
Proportion of people is used for outcome indicators and represents the percentage of individuals in a specific group who have achieved or experienced a particular result, such as gaining access to services or adopting new behaviours. These indicators are typically based on survey data from primary stakeholders or people in the target area who may have been affected by the intervention.

When it comes to reporting the proportion, it’s essential to report the extrapolated total number of people who were positively affected and NOT the percentage as percentages cannot be aggregated.
Number of “things”: Some output indicators count tangible outputs (e.g., water points, roads, hectares of land) that directly benefit people. Although these are physical structures, they are categorised as "people" indicators because the output leads to direct use by people, regardless of whether the work was carried out through direct implementation, partnerships, or changes in framework conditions.
Couting People Indicators
Output indicators
Output indicators are usually measured as either “number of persons” or “number of ‘things”. These are usually measured on a continuous basis as activities are being implemented. To report on these indicators, simply add up the unique number of persons who participated in, received support from, or gained access to something through the project’s activities within the reporting year. Shortly put only report NEW primary stakeholders every year.
For multi-year projects, persons who participate or receive support in multiple years should be counted in each relevant year. However, to avoid double-counting, the project-to-date total must be adjusted accordingly. The project-to-date total can be therefore accumulated over the years. See below for an example
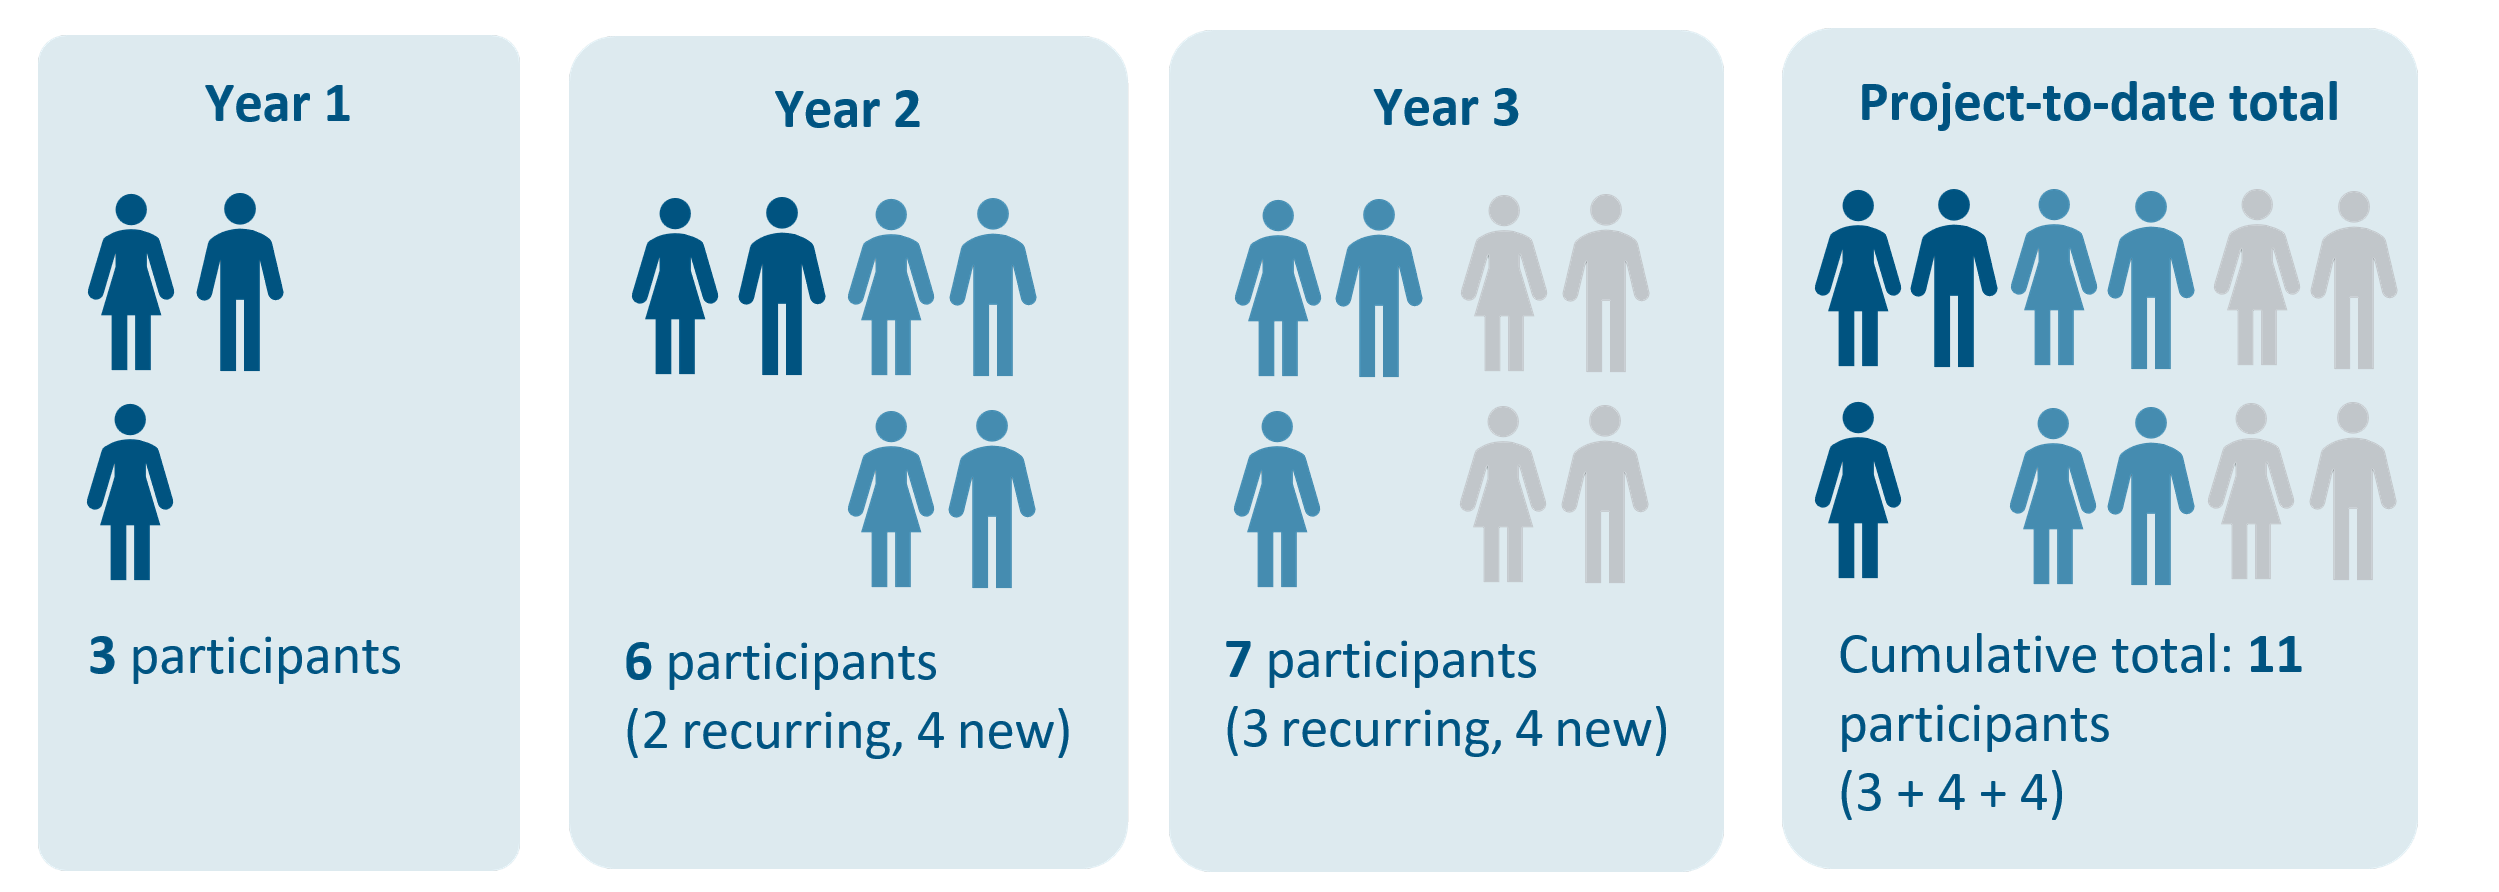
The project-to-date total is reported annually under REACH 001. At the thematic output level (e.g., WFC, SJI, VIC), performance indicators—such as WSG 1.1.1 (new persons gaining access to drinking water)—should only count individuals once per year when they first gain access. For example, if three participants were reported in Year 1, they should not be counted again under the same indicator in Year 2.However, if these same individuals participate in a different activity in Year 2 (e.g., FAN 1.2.1), they can be reported under that new indicator for that year, but not under REACH 001 again. In general, all output indicators should report only new primary stakeholders each year, ensuring that the project-to-date total (REACH 001) includes each person only once across the entire project duration.
Avoiding double counting and unique primary stakeholder especially under Reach 001: Implementing a case management system would help prevent double counting. Each household would be assigned a unique ID, QR code, or barcode card. Whenever a household participates in any activity, this unique ID would be used to track the type of support received. This is particularly useful when different household members engage in separate project activities. Additionally, surveys could later be conducted using these unique IDs, eliminating the need to repeatedly collect data on household size, composition, and income. However, setting up such a system properly can be time-consuming and costly. For more details, see PART 2: Guidance for People Reached Counting and Reporting
Outcome indicators
Outcome indicators are typically measured as either the "number of people" or the "proportion of people" and are based on surveys conducted with a representative sample of the target population. However, only total numbers should be reported as percentages cannot be aggregated. Though, for communication percentages are used. These surveys take place at baseline, mid-term, and/or endline (sometimes annually), depending on the intervention and the expected timeline for changes in outcomes.
For these indicators, we always report the most recent data as the project-to-date total, as they provide a snapshot of the current results achieved. Unlike output indicators, outcome indicators are not cumulative over the years—the latest survey results replace previous ones.
The key insight from these indicators comes from comparing baseline data with follow-up survey results. The endline survey will provide the final and definitive measure of the project’s impact.
There are two main types of “number of people” indicators:
Number of people with increased/decreased ‘something’: For this indicator, the endline or follow-up survey value is based on either (a) a direct comparison of baseline and endline data for each respondent (a longitudinal survey) or (b) a survey question asking respondents to compare their current situation with a previous one and indicate whether the condition has increased, decreased, or stayed the same. In option b), the baseline values are not needed, as the measure itself represents a change in conditions.
Number of people applying/doing ‘something’: This indicator applies only to primary stakeholders and can be more complex, as the sample population in different years (e.g., baseline and follow-up surveys) may not be the same, and there may be some overlap of primary stakeholders from one year to the next. To handle this: adjust for overlap if you know some people participated in both years, count them only once in the overall total. Another solution is to clearly separate each year’s sample, noting any changes in the participant group. This helps maintain consistency in reporting and makes it easier to track progress within each cohort. Or if the group size changes, try to keep the same sample ratio each year. This helps ensure the results are comparable over time.
Below is an example of how to report on outcome indicators based on samples (one illustrated person
represents 10 individuals):
