Indicator Handbook
PERFORMANCE INDICATORS 2025-2028
Revision Date: 06.04.2025
Any feedback or questions can be directed to: David Streiff
Introduction PERFORMANCE INDICATORS 2025-2028
This handbook introduces HELVETAS’ global set of standardised Performance Indicators, developed for use by HELVETAS staff and implementing partners. The document has three main sections:
A general introduction to the results framework and its structure
Detailed guidance on how to count and report the number of people reached
An overview all performance indicators, including links to detailed guides for each indicator outlining definitions, data sources, collection methods, and reporting instructions
Performance indicators are a key element in HELVETAS global monitoring, evaluation, accountability, and learning (MEAL) structure. They measure and report progress towards expected targets and results, helping projects make informed adjustments to activities and approaches while ensuring accountability to donors and stakeholders. Global standardised performance indicators promote consistency and comparability across projects and regions, making it easier to assess outreach and share results on a wider scale. The indicators in this guide are mandatory when they align with a project’s theory of change, logframe objectives, and activities. Additional, donor or project-specific indicators will of course still be an integral part of a projects logframe and monitoring system. However, as many indicators from this guide should be aligned to their specific logframe indicators. This will be explained in the section 1 on how to use PIs.
Structure and Flexibility of the Global Results Framework
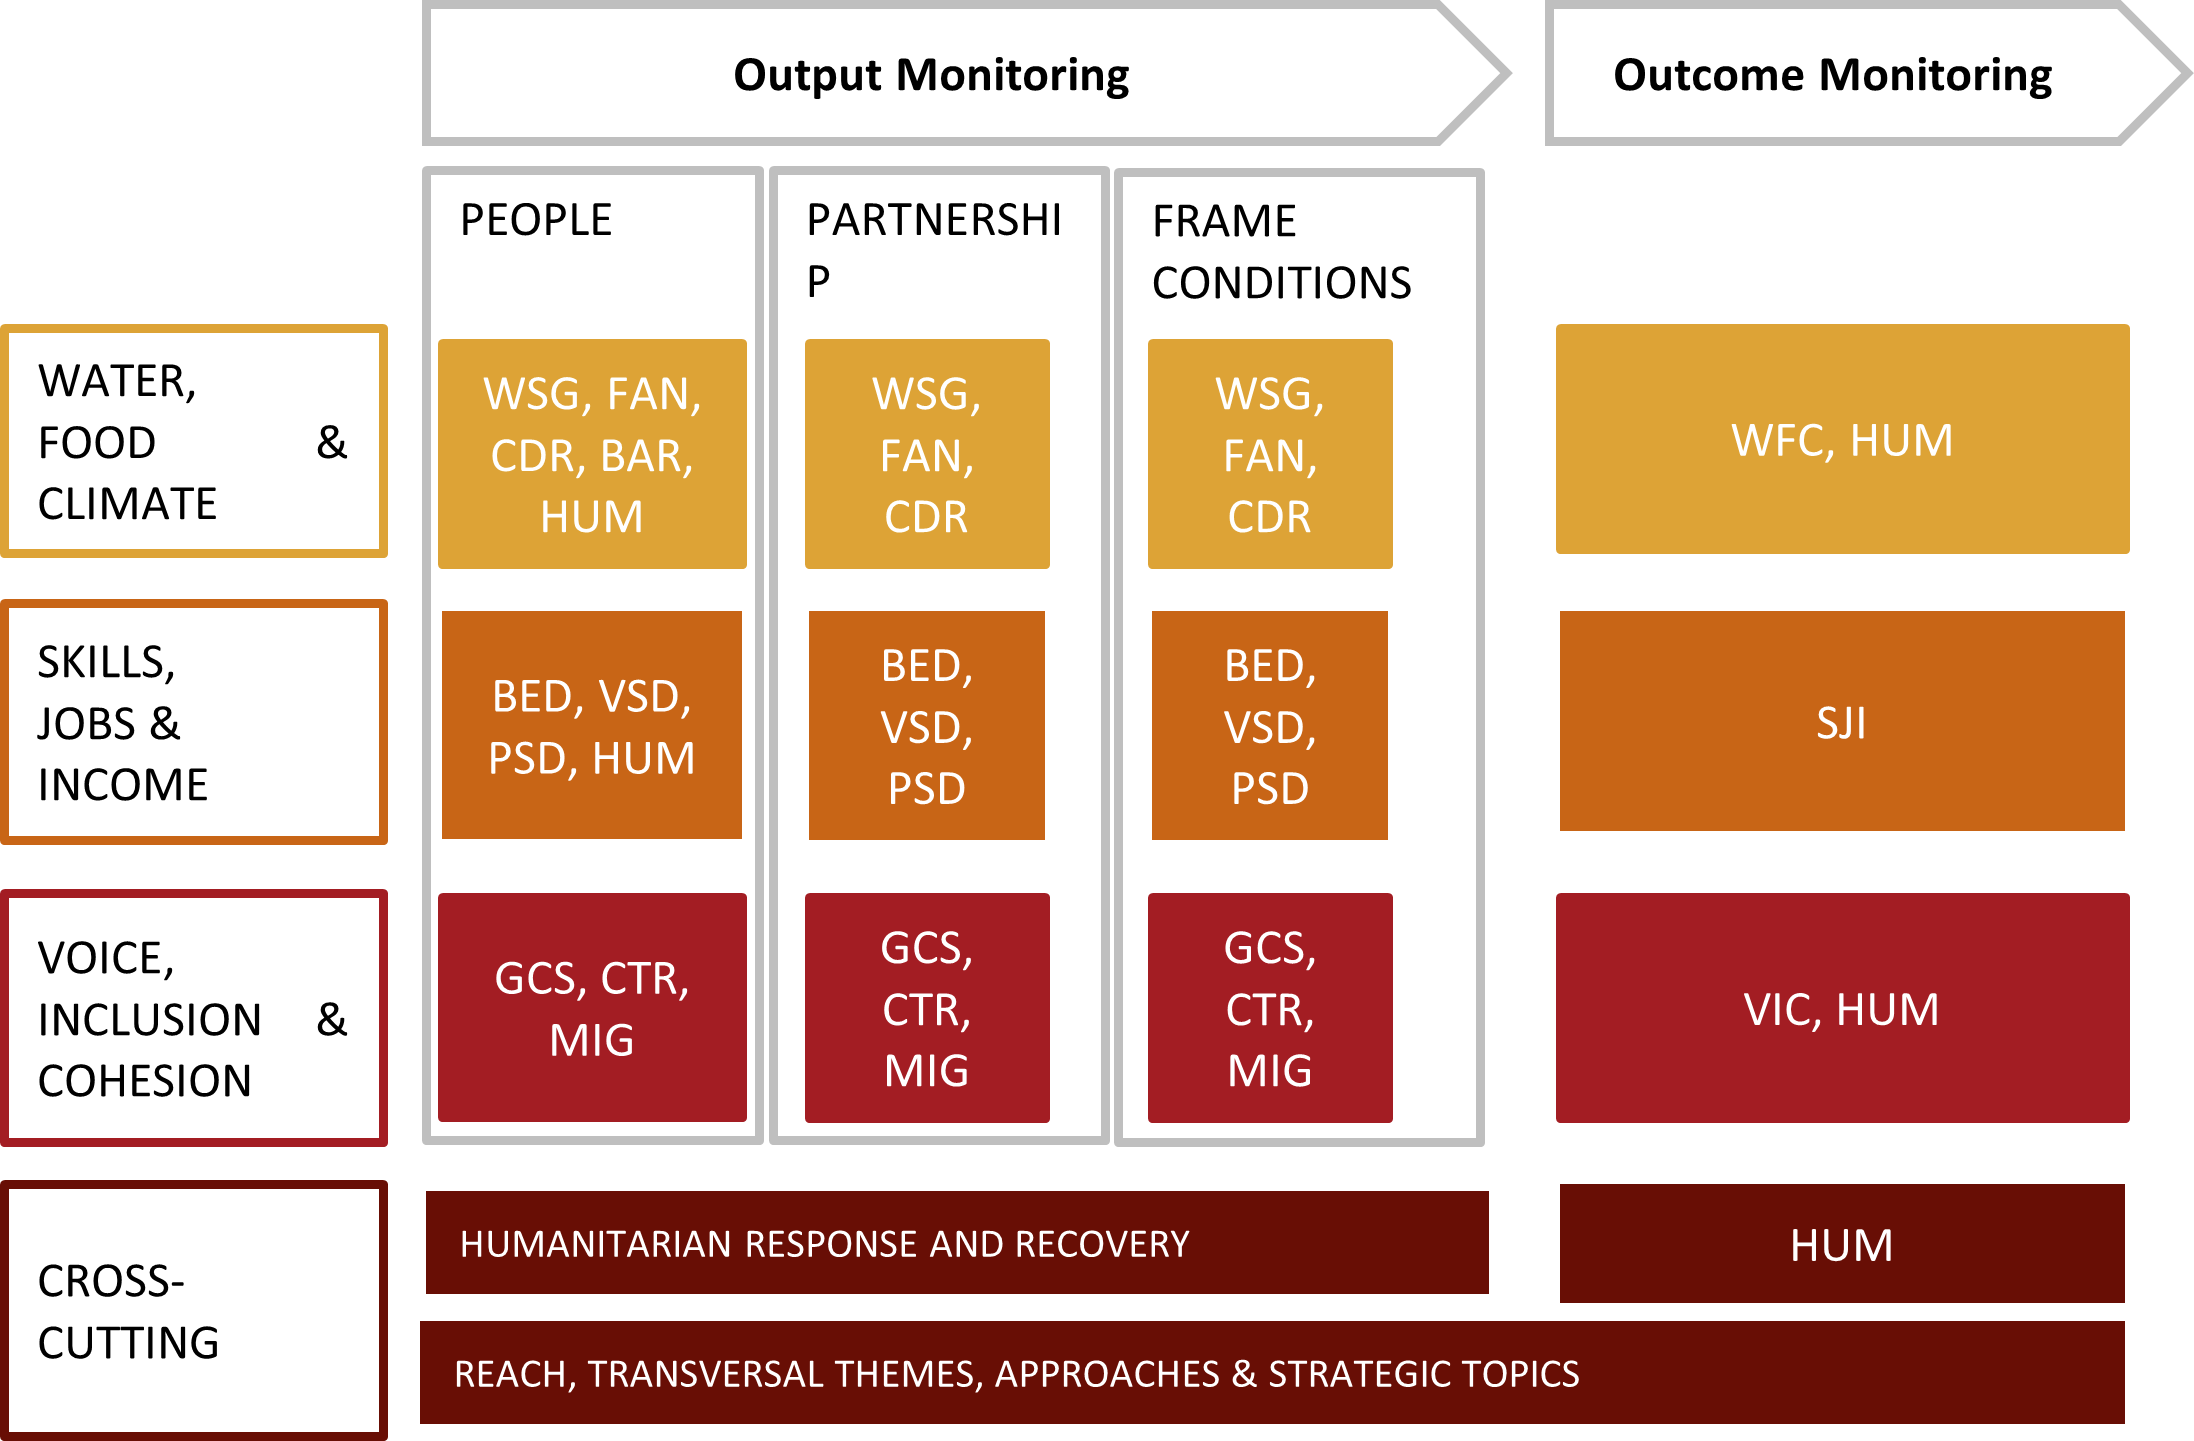
Performance indicators are categorised into output and outcome indicators. Output indicators track the immediate results of activities and inputs. At HELVETAS, these are grouped under 10 working fields and measure factors such as the number of people reached, the number of civil society organisations (CSOs), and the number of public or private actors capacitated or initiatives supported. Outcome indicators measure the changes or benefits resulting from project activities. These changes generally take more time to emerge and may be influenced by factors outside the project’s control. HELVETAS organises outcome indicators into three working areas: Water, Food and Climate (WFC); Skills, Jobs and Income (SJI); and Voice, Inclusion and Cohesion (VIC). In addition to thematic output and outcome indicators, HELVETAS uses a set of cross-cutting indicators that apply to all projects, regardless of their working area.
Some indicators may also be relevant to projects outside their primary working field, depending on the project’s theory of change and objectives. In general, projects should select all indicators that are relevant, regardless of working field categorisation. For example, an increase in income (an SJI indicator) may be relevant for Food Systems and Nutrition (FAN) projects, while an increase in social cohesion (a VIC indicator) may apply to WASH and Water Governance (WSG) projects.
Project indicators can be adjusted and do not need to match the exact wording of the performance indicators. This flexibility allows for customization to better align with the projects or donor’s requirements. As long as the meaning and intent of a project-specific indicator are consistent with a standardized performance indicator, they can be aligned. In such cases, the project-specific indicators will contribute to the overall total of the standardized performance indicator
We strongly encourage projects to use the same data collection method—including data sources, data collection procedures, and, if applicable, Kobo forms—as specified in the performance indicator guidelines.
The figure illustrates the results framework in a nutshell and how it aligns with the HELVETAS Swiss Intercooperation Programme Contribution 2025-2028.
When to use the PIs
PIs should be used integrated into project monitoring as much as possible. The rule is at least one outcome PI per project and one Output PI, but the more the better. PIs offer the advantage, that they are well defined and digital survey forms are already available and save time for projects.

However, if they don’t fit your project, they don’t fit so no need to squeeze them in if it doesn’t make sense!
How to use the PIs
Projects often need to include donor-specific indicators in their logframes. Many donor indicators are similar to HELVETAS’ institutional performance indicators and can be aligned. We recommend discussing with donors the possibility of using HELVETAS indicators. If that’s not possible, the HELVETAS indicator guides can still help collect data for the respective donor indicators and should be aligned to the donor indicators.
Additionally, each HELVETAS indicator also suggests which donor indicators it can cover (currently mostly SGS, SDC, EU and USAID if you find other donor indicators pleas directly contact david.streiff@HELVETAS.org). To align donor indicators with project logframes, start by matching project-specific indicators with HELVETAS performance indicators to identify overlaps. This process allows existing logframes to integrate or adapt to fit the HELVETAS global framework.
Such alignment ensures that project performance and goals align with HELVETAS’ organizational indicators. It also enables consistent data collection across projects, helping to assess global impact and progress more effectively. By integrating global indicators into project logframes, HELVETAS can ensure uniform reporting and better comparisons across countries and regions.
The performance indicators (PIs) are not just valuable for Head Office (HO); they also hold significant importance for countries and regions. Because these indicators are standardized, they can be aggregated at national or regional levels, providing a clear picture of overall achievements. This comprehensive view is useful for decision-making and strategic steering, enabling better planning and prioritization. Additionally, countries and regions can use these aggregated results as a powerful tool for marketing, showcasing their progress and accomplishments to stakeholders, partners, and the public.
