Indicator Definition
| Indicator Name | WFC 1.8 Number of smallholders who increased their net productivity per hectare |
|---|---|
| Indicator Definition | This indicator measures the number of smallholders who increased their production per hectare based on environmentally sustainable and climate resilient practices. The volume of production per hectare is compared before and after project interventions, accounting for changes in input use. This indicator focuses on tangible increases in output while recognizing that the full environmental and social benefits of sustainability may not be fully captured in these measurements. |
| Related to Old Performance Indicator | FAN 313 |
| Indicator Level | Outcome |
Disaggregation
| Disaggregation |
|
|---|---|
| Measuring Unit | Smallholders engaged in agricultural activities within the project area who have adopted environmentally sustainable and climate-resilient practices (primary stakeholders). |
Kobo Questionnaires
The column "net_production_area" indicates the net productivity per hectare for each respondent
Examples of Actvities
Training: Smallholders are trained in sustainable farming techniques (e.g., soil improvement management, water-efficient practices).
Input Support: Provision of improved seeds, organic fertilizers, and other inputs aimed at increasing crop productivity.
Agroecological Practices: Promoting sustainable practices that enhance yield while protecting the environment.
Irrigation Access: Facilitating access to water-efficient irrigation systems to improve water availability and usage.
Climate-Resilient Crops: Supporting the adoption of climate-resilient crops and farming techniques.
Data Collection
| Data Source and Means of Verification | Surveys, interviews and financial diaries are used to gather information on farming practices and input usage from smallholders collected at least before and after the intervention. |
|---|---|
| Measuring Frecuency | At least baseline and endline |
| Data Collection Guidance | Interview smallholders and record what practices they’re using and their inputs and their yields per hectare. Alternatively, encourage smallholders from the very beginning of the project to maintain a simple logbook where they record the production (and income) themselves. The data collected should include at least:
The interviews and/or diaries should be verified with field notes, photos, and/or videos to show what’s happening on the ground. These various forms of evidence provide reliable verification that smallholders are adopting and consistently applying the sustainable practices promoted by the project. For adhering to voluntarily sustainability standards such as fair trade, organic or other sustainability verifications such as Rainforest, UTZ, FSC etc. please use the questionnaire from WFC 1.7. This questionnaire asks for certification. |
| Common Challenges |
How to report
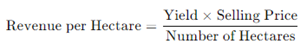
Total Revenue per Hectare: Multiply the total yield by the estimated selling price and divide by the number of hectares.
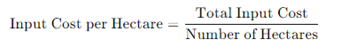
Total Input Cost per Hectare: Convert each input (e.g., labor, seeds) to monetary terms, calculate total input costs, and divide by the number of hectares.
Gross Margin per Hectare: Subtract the total input costs from the total revenue to determine the Gross Margin per Hectare.
Change in Gross Margin: Subtract the Gross Margin at baseline from the Gross Margin at follow-up.
Count the Number of Smallholders: Count the smallholders whose Gross Margin per hectare has increased from baseline. Any increase will be counted as improved productivity.
Extrapolate Results: If based on a sample, extrapolate the results to estimate the total number of smallholders who increased their production across the project. Example: If a project involves 500 smallholders, and a sample of 220 is determined to be statistically significant, and 70% of this sample increased their production value and as well as possibly their income, then you can conclude that 350 smallholders (70% of 500 smallholders) have a) increased their production and report under WFC 1.8. The Kobo questionnaire also calculate the net income for the farmers which then can be reported under SJI 2.1.

Please note that the percentages for these two indicators can differ. For example, a farmer might increase their net production value but may not be able to sell more and therefore cannot increase their income.
Related Indicators
| Related Donor Indicators | SDC AFS_ARI_1 Number of smallholder farmers with increased incomes from agricultural production IFAD:
FAO: SDG 2.3.1. Volume of production per labour unit by classes of farming / pastoral / forestry enterprise size |
|---|---|
| Related HELVETAS Indicators |